I’m trying to understand river flow data to develop “go, no-go” criteria for day trips. The data is so relative to each stream’s, each gage’s histories, seems one must be familiar with such history for a particular station. Are there any measures that give a quick reference as to he stream’s flow conditions?
-
Happy Wright Brothers Day (1903)! 🐱🦅🛩️
You are using an out of date browser. It may not display this or other websites correctly.
You should upgrade or use an alternative browser.
You should upgrade or use an alternative browser.
Water Flow Data Interpretation
- Thread starter Black_Fly
- Start date
Yes, it's all dependent on the individual body of water so far as I know. There is no universal rule or quick reference.
If you regularly paddle those routes it doesn't take long to figure it out and you can look at historical data as well so if you remember a trip that was too low to paddle enjoyably look up that date and see what the flow was.
Alan
If you regularly paddle those routes it doesn't take long to figure it out and you can look at historical data as well so if you remember a trip that was too low to paddle enjoyably look up that date and see what the flow was.
Alan
It's not easy to interpret flows/gages in the beginning. There are some guide books for certain areas and streams but I don't know how inclusive they are.I’m trying to understand river flow data to develop “go, no-go” criteria for day trips. The data is so relative to each stream’s, each gage’s histories, seems one must be familiar with such history for a particular station. Are there any measures that give a quick reference as to he stream’s flow conditions?
Like everything these days...Google the stream AND the gage closest to where you'd like to paddle and search for input from others who have done that stretch.
One thing I do after a trip is to send myself an email with trip notes...gage reading, potential hazards, fishing results, camping options, etc. I keep those emails in a folder on my laptop. I refer to them often.
One thing I have been doing is looking at nearby outfitter websites. A lot of time they link to the website of the relative gauges and also tell you what the minimum should be. Sometimes, though, you are on your own figuring out what is "good enough".
I used to be a surface water hydrologist. Flow is measured by wading with a staff and a Price or pygmy meter. Larger rivers often have a small carriage on a cable system. A hydrograph can be developed over time to correlate the measured discharge Q or flow. There will be a gauge or stilling well to measure the height of the flow. Often there is a simple marker with height in feet on a bridge abutment.
The crucial step is correlating a known gauge height to the discharge. Hydrologist stations that have been in existence for awhile have this capability. Read the gauge height and it can tell you the discharge.
Look up the records for a known river. You can go by the date for USGS stations. If you drive by a river gauge note the height. Keep a log for your local rivers.
For USGS gauges the discharge (flow) datum is a derived value based on the stage height in feet and inches at that particular gauge, not a real-time value. The accuracy of the discharge value is affected by changes in the volume of the streambed which can result from bank erosion, silt and gravel deposition in the streambed, and other factors. But the USGS does periodically check the veracity of the discharge data in the manner described by ppine.
Stage value has no universal concrete predictive value and is solely dependent on the location of the gauge. A stage height of 2 feet might represent a high water value on one gauge on one stream and a very low water value on another. Discharge data has at least some concrete meaning. If you paddle enough rivers and streams you will start to get an appreciation of what a particular discharge in cubic feet per second represents based on the volume of the streambed.
On a fairly narrow "steep creek" a cfs of say 250 might represent very fast and high water whereas it would represent but a trickle on a wide, deep river bed. For whitewater streams the American Whitewater website has recommended discharge ranges for individual runs.
Last edited:
If the river has any whitewater, even upstream, you may find a good source of info in the AMERICAN WHITEWATER website in the river info section. It is broken down by state with the rivers color designated in Low, Running and High depending on the flow, which is updated regularly. You can also click on a river to get other info such as maps, put-ins and take-outs, and river reports.
This has been my go-to river data source when I am looking for a river to paddle.
This has been my go-to river data source when I am looking for a river to paddle.
As others have said, you have to somehow know the flow at a specific stream gage that is un-runnable, either through your personal observation, or through other paddlers, paddle shops, online resources etc. Once you know that number you just go to the real time flow conditions for that gage and make the decision. Historical records only show you what you might expect in the future with regard to seasonal peaks or low flows. One of my frequented rivers is almost completely dewatered duing the summer irrigation season, and becomes unrunnable after snow runnoff season. Then all of a sudden, in mid September, flows jump and the river can be run again. The jump is associated with irrigation being shut off. It happens ever year on about the same date, which can be seen scrolling back through the USGS data.
Mark
Mark
In Canada river flow information can be found here:
 wateroffice.ec.gc.ca
For Quebec only (not included in the Canadian data) you can find the info here:
In both you can find historical data which sometimes goes back well over 50 years.
I spend a ridiculous amount of time studying the data in March and April when I'm planning my Spring trips. It can take many years to get a good grasp of the data for a specific river and what it is likely to mean looking forward. While I've become reasonably skilled at predicting it only takes a short period (days) of heavy rain, an early or late Spring melt to require a recalculation and new prediction. This is especially true for smaller rivers/watersheds where just a fairly small difference can turn a nice run into a real drag.
Real-Time Hydrometric Data - Water Level and Flow - Environment Canada
For Quebec only (not included in the Canadian data) you can find the info here:
Water Level and Flow Rates
Champs d'activités du centre d'expertise hydrique du Québec - CEHQ
www.cehq.gouv.qc.ca
In both you can find historical data which sometimes goes back well over 50 years.
I spend a ridiculous amount of time studying the data in March and April when I'm planning my Spring trips. It can take many years to get a good grasp of the data for a specific river and what it is likely to mean looking forward. While I've become reasonably skilled at predicting it only takes a short period (days) of heavy rain, an early or late Spring melt to require a recalculation and new prediction. This is especially true for smaller rivers/watersheds where just a fairly small difference can turn a nice run into a real drag.
In a practical sense, the absolute lowest runnable discharge for canoes is around 250-400 cfs for larger creeks and rivers. Sometimes a little less.
If you see bank full discharge use caution. The primary flood plain is under water.
If you see flow up in the trees in the secondary floodplain, think twice about running a river at that flow. Along with that comes eroding banks, falling trees and lots of strainers and wood debris. Increased velocity makes everything more difficult. Some bridges may not be navigable. Boat ramps are under water.
- Joined
- Jun 22, 2017
- Messages
- 1,232
- Reaction score
- 1,472
The USGS data can provides hints. If the flow is way below average then smaller rivers may be full of obstructions. If there are reviews available and the flow is around average the river is likely to behave like the reviews. If the flow is at record levels it's probably not the best time to try a new-to-you river.
Daily discharge, cubic feet per second -- statistics for Jul 16 based on 93 water years of record more
Daily discharge, cubic feet per second -- statistics for Jul 16 based on 93 water years of record more
| Min (2012) | 25th percen- tile | Median | Mean | 75th percen- tile | Max (2015) | Most Recent Instantaneous Value Jul 16 |
|---|---|---|---|---|---|---|
| 822 | 1770 | 2280 | 2490 | 2940 | 7010 | 8790 |
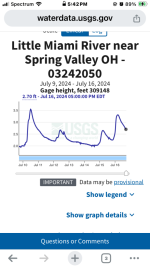
It appears she’s just over the median depth right now. That section can be pretty rocky in most conditions. So I guess the only way this makes sense is if I know what a given depth paddles like.
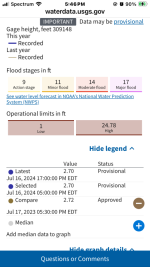
The graph you are looking at shows the stage, not the discharge (flow). Not all USGS gauges register discharge data and this one does not. Unless you know the river at the location of the gauge well, the stage does not have any concrete meaning and cannot be readily converted to discharge.
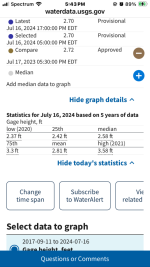
But you can see what the median stage for this gauge is which is 2.42' for this date over the last 5 years of collected data. So presently the stage is slightly below median for this date.
I do not know the Little Miami River. Many rivers tend to be lowish in the drier months of Summer so a median level for this date might indicate a lower flow situation. Or it may not. Unless you know the river the stage data is not all that helpful.
2.70 is above the median of 2.58, correct?The graph you are looking at shows the stage, not the discharge (flow). Not all USGS gauges register discharge data and this one does not. Unless you know the river at the location of the gauge well, the stage does not have any concrete meaning and cannot be readily converted to discharge.
But you can see what the median stage for this gauge is which is 2.42' for this date over the last 5 years of collected data. So presently the stage is slightly below median for this date.
I do not know the Little Miami River. Many rivers tend to be lowish in the drier months of Summer so a median level for this date might indicate a lower flow situation. Or it may not. Unless you know the river the stage data is not all that helpful.
Right now the American Whitewater site is showing the Little Miami River as "Low Runnable", with the East Fork and the Clifton Gorge (Section 1) below recommended levels.
Below I’ve copied a useful link for finding “canoeable” rivers and creeks in western Pennsylvania. My understanding is this site is regularly maintained. It shows whether water levels are “too low”, “canoeable”, or “too high”. It’s a great resource that should be used as a reference alongside common sense and good judgement. Someone showed me this earlier in the year (I forget who).
Yes, you are correct. I was interpolating the graph incorrectly. Not that less than an inch and a half is likely to make much difference in most cases.
Love to have a resource like that. Although, “runnable in a $3,000 composite hull” would be a better measure. I regret selling my royalex Argosy for this river. Shelves come out of nowhere and rock gardens are frequent. It gets progressively deeper closer to Cincinnati, as more creeks and effluent contribute to the flow. I avoid the lower sections due to outfitter traffic.Below I’ve copied a useful link for finding “canoeable” rivers and creeks in western Pennsylvania. My understanding is this site is regularly maintained. It shows whether water levels are “too low”, “canoeable”, or “too high”. It’s a great resource that should be used as a reference alongside common sense and good judgement. Someone showed me this earlier in the year (I forget who).
Last edited:
Love to have a resource like that. Although, “runnable in a $3,000 composite hull” would be a better measure. I regret selling my royalex Argosy for this river. Shelves come out of nowhere and rock gardens are frequent. It gets progressively deeper closer to Cincinnati, as more creeks and effluent contribute to the flow. I avoid the lower sections due to outfitter traffic.
Sounds like it's time to add an old beater Royalex canoe back to the quiver!
Similar threads
- Replies
- 55
- Views
- 5K
- Replies
- 23
- Views
- 5K


